Dealing with MacBook CPU throttling
About two months ago, I switched from the Elastic Cloud SRE team to one of the Kibana software teams at Elastic. This has had me using a lot fewer cloud instances and a lot more of my local laptop CPU.
Elastic gave me a fairly new MacBook Pro (16-inch, 2019), with a 2.4 GHz 8-Core Intel Core i9 and a whopping 64 GB 2667 MHz DDR4. By all means this computer should be crazy fast. But when I ran yarn kbn bootstrap for the first time, my computer was terribly slow. Even typing in my local slack app was lagged like I was on a bad SSH connection.
So I started trying to figure out why.
Googling macbook pro throttling led me quickly to this apple toolbox post which recommended checking like this:
❯ pmset -g thermlog
Note: No thermal warning level has been recorded
Note: No performance warning level has been recorded
2021-09-03 13:22:05 +0900 CPU Power notify
	CPU_Scheduler_Limit 	= 100
	CPU_Available_CPUs 	= 16
	CPU_Speed_Limit 	= 34
Ouch. 34 looked pretty low.
Next I tried the Hot app, which at least told me when I was throttling, but not much about why. Also the temperature was quite a bit lower than I expected.

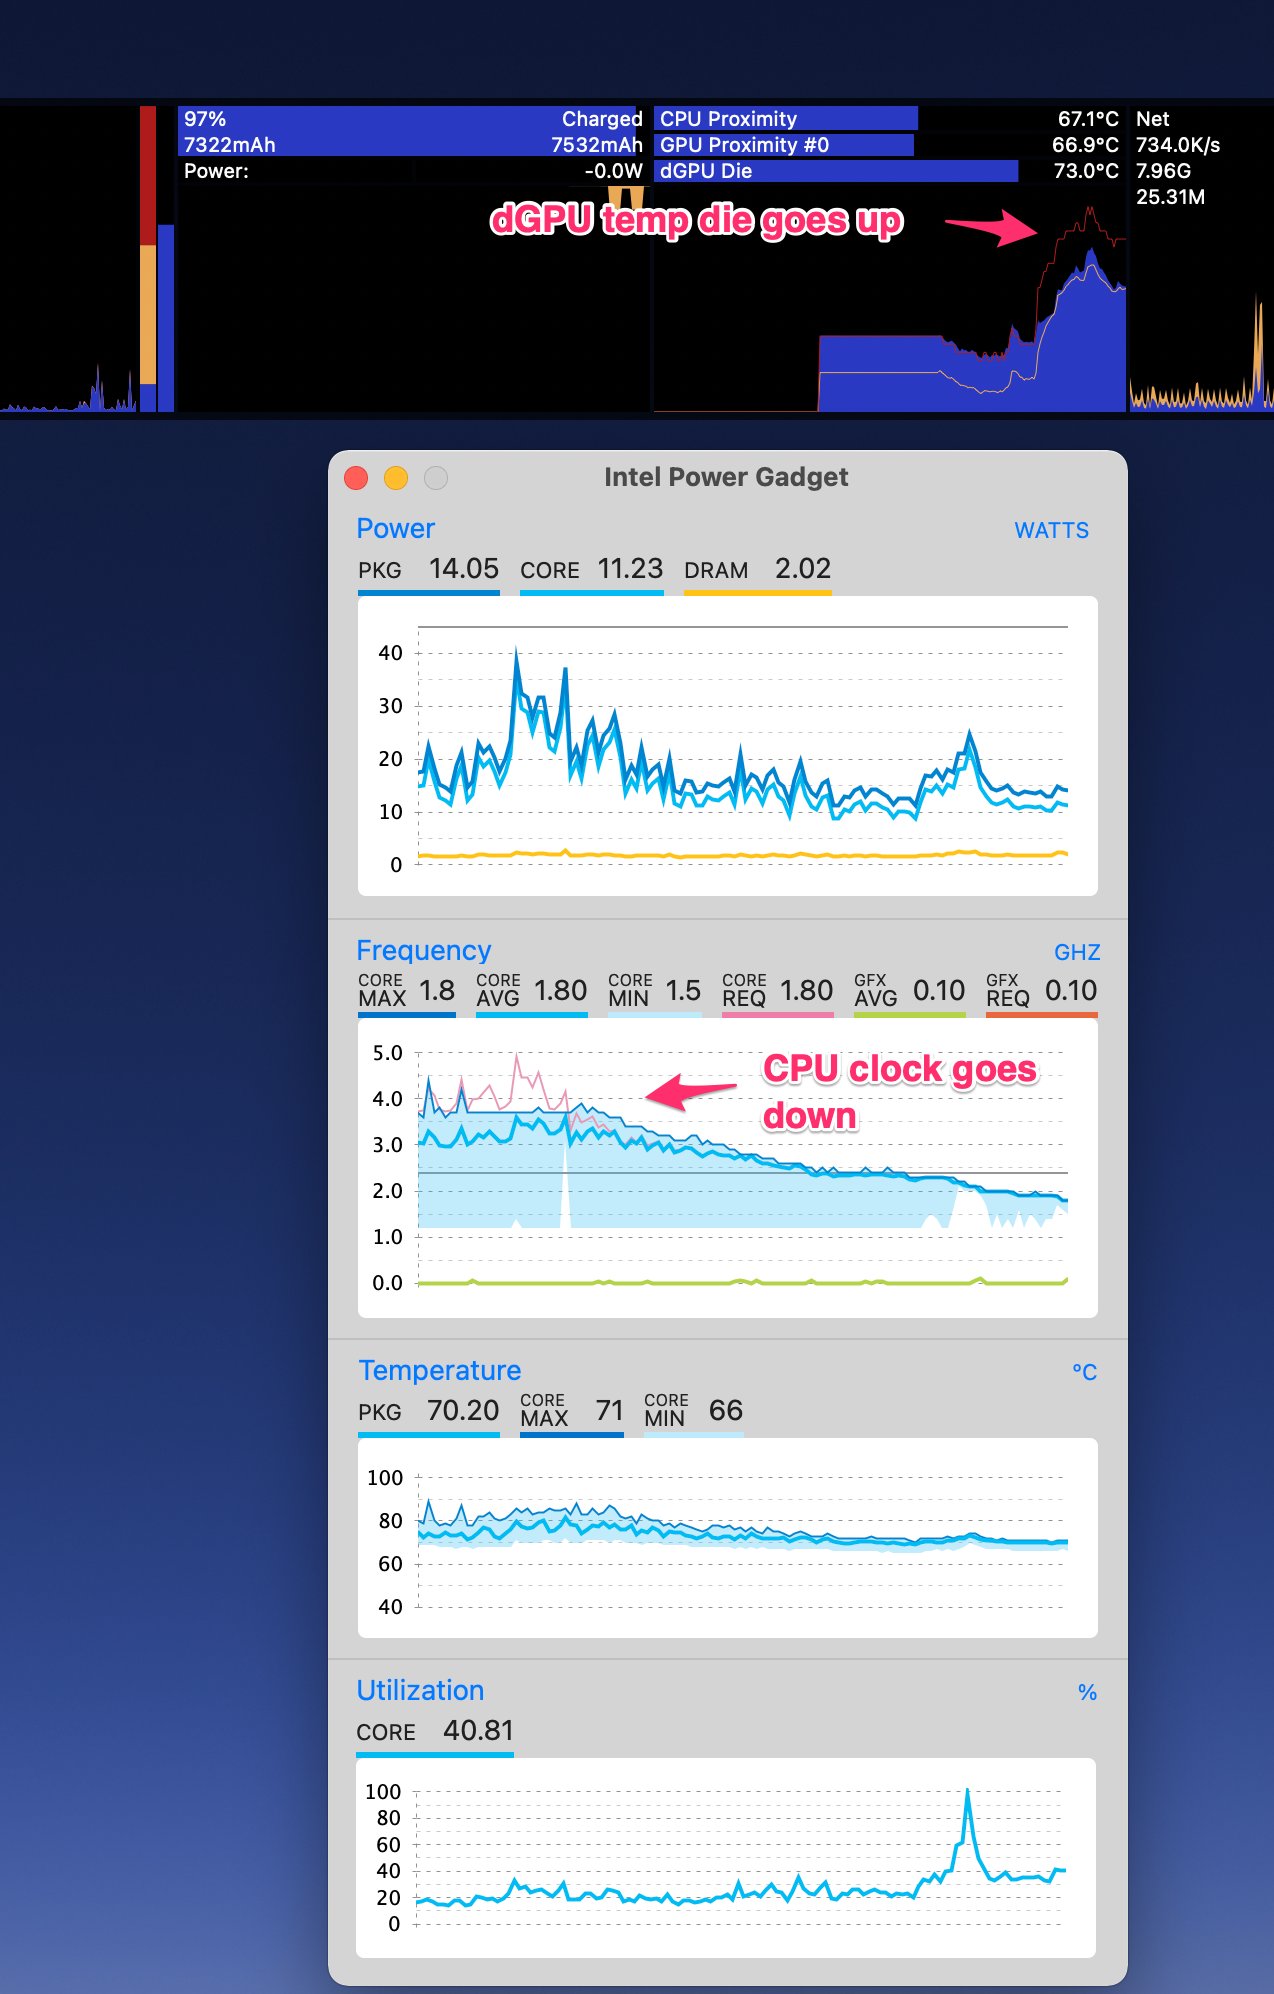
So I tried Intel Power Gadget next. This had a lot more detail, I still couldn’t work out the reason for the throttling. I’d read about possible external display problems so I unplugged it and saw my CPUs jump back.
I tweeted this out and it started a nice thread that led me to consider my discreet GPU.
After a bit more digging, I found XRG which included configurable temperature sensor graphs, including the dGPU.
With some new tools in hand, I started working and sure enough I could see that the throttling kicked in when my dGPU got up to around 80C.

About this time, I also needed to do some work on VirtualBox which conflicted with the Intel Power Gadget. So I found this as a replacement to watch my core speeds, which XRG couldn’t.
❯ sudo powermetrics --samplers cpu_power | grep 'CPU Average frequency'
CPU Average frequency as fraction of nominal: 105.85% (2540.51 Mhz)
CPU Average frequency as fraction of nominal: 97.23% (2333.44 Mhz)
CPU Average frequency as fraction of nominal: 105.58% (2533.88 Mhz)
...
The throttling is actually easier to spot this way because all the cores will sync to the same reduced clock speed even when processes are putting demand on the CPU.
CPU Average frequency as fraction of nominal: 75.00% (1800.00 Mhz)
CPU Average frequency as fraction of nominal: 75.00% (1800.00 Mhz)
CPU Average frequency as fraction of nominal: 75.00% (1800.00 Mhz)
Now I’m far from a hardware heat-management expert here. But from various posts I can see that the CPU and GPU share a heat sink. And the dGPU is required to drive the external display. So what seems to be happening is that when display is plugged in, the dGPU starts heating up. If the system decides the GPU is too hot for the CPU to cool itself, it slows down the CPU to avoid overheating and potential damage.
Of course, I’m glad I still have a working laptop, but I’d also like to have a fast laptop :)
So far the best workaround I’ve found is the combination of a cooling stand (with fans) and keeping the air conditioning a little uncomfortably cold.
Or if I can live without my external display for a bit, I’ll unplug it and work on the laptop display. Usually until whatever big CPU job (often kibana bootstrap or optimizer work) is done then I can plug it back in.
I’d love to take it to the Apple Store to check if the fans are okay. It could be they’re dusty as Sergey Stadnik found in this post. But my location, COVID19 and vaccine shortages eliminate that possibility.
Maybe next year 🤞