Monitoring my home internet with Elastic
Since the start of COVID19, my home internet has gotten noticeably slow between the hours of 8p and midnight (JST, local).
I suspect this is a widespread issue as more people are staying home and doing things that exercise both local and global internet connections.
My ISP seems to do a decent job keeping things like video streaming prioritized, but work can be a big pain. Operations like apt update/install on a local VMs, npm install, browsing company websites can get very slow. It’s even worse when I’m on a full-tunnel VPN as I suspect in this case my ISP can’t make any sort of traffic priority decisions.
For the last year, I mostly ignored it. With so much of the world suffering and dying, it’s difficult to complain about slow internet.
But it’s gone on so long now I decided to at least get scientific about it.
The approach
I figured if I could have something like Ookla Speedtest running continually and storing data, I could demonstrate and quantify the issue.
But what to use?
Internet Speed Logger
Having recently helped out Elastic Uptime I first reached out there.
It was notably outside their intended scope, but the project’s PM mentioned he’d done similar home network testing with Brennen Smith’s Internet Speed Logger
This got me some quick results:
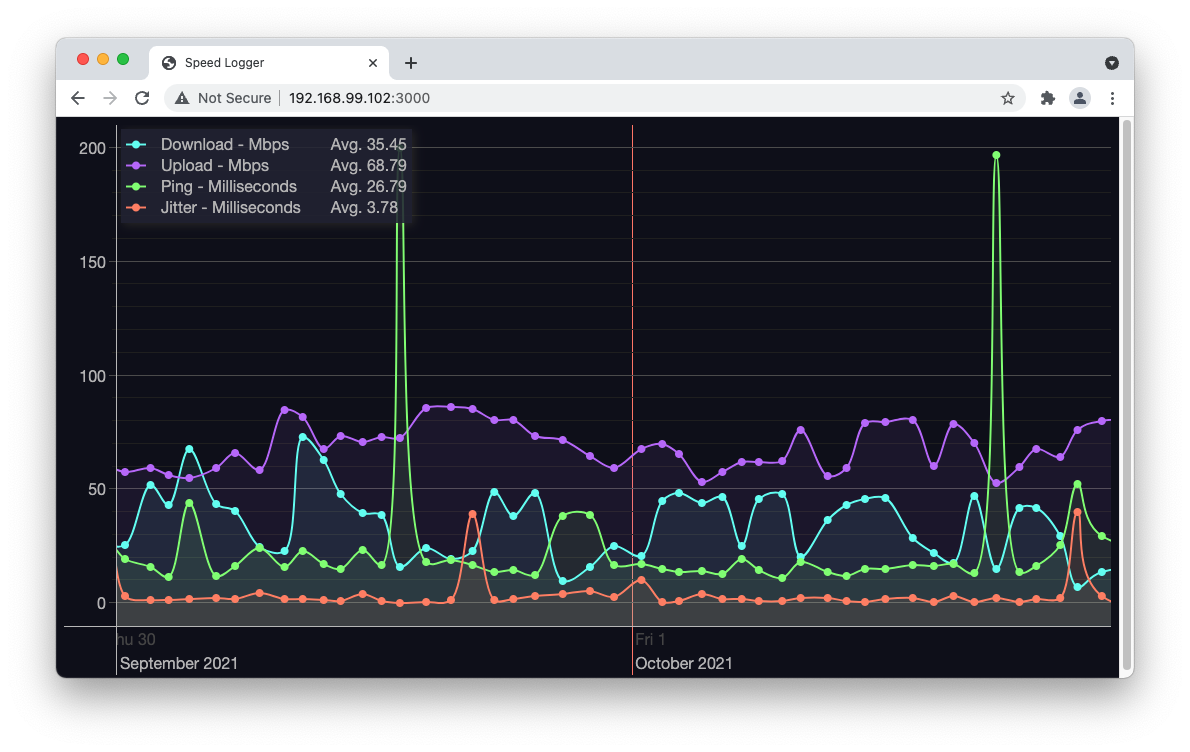
But it left something to be desired. It was hard to see what time the dips were happening and I didn’t see any options to change aggregations or do other processing. I’d probably have to hack on the code directly to draw useful conclusions.
Additionally this was a mongodb+node setup on docker compose. Easy to do on my MacBook, but a little trickier to run from my Raspberry Pi 4 which was the handiest stable computer on my network.
Using the Elastic Stack
I mentioned my testing in passing to one of my coworkers, Toby Brain, who said he did something similar with the Ookla CLI shipping data to Elasticsearch.
This sounded great for the following reasons:
- I could host Elasticsearch & Kibana on cloud.elastic.co and not worry about data storage availability
- Filebeat and the Ookla CLI should be light enough to run on my Raspberry Pi
Setting up the cluster
This was easy! Just go to cloud.elastic.co, sign up and make a cluster.
If you don’t happen to work at Elastic, you’ll get at 14 day free trial. If you want more, you could start a paying plan, or consider getting a job at Elastic ;). Or of course you could also host your own elasticsearch and kibana on a spare machine with enough resources (but probably not a Raspberry Pi). The data set is quite small. Only about 600kb for 3 days so far.
Setting up the Ookla CLI
Installation here is easy. Just grab a copy from the speedtest cli download page for your process (arm in my case) and untar it. Move the binary somewhere handy (like /usr/local/bin).
One small “gotcha” is that each user has to run it once with no args to accept the EULA which will write into $HOME/.config/ookla). No big deal for my setup, but if you have users without home directories or something, watch out for it.
To run the speed test and get json output, you’ll need a server ID. You can get one like this:
$ speedtest -L
Closest servers:

    ID  Name                           Location             Country
==============================================================================
 45080  ド田舎ネットワーク!By mino7r86. Kawagoe              Japan
  6087  Allied Telesis Capital Corporation Fussa-shi            Japan
  6492  denpa893                       Tokyo                Japan
 41592  NEVERLOSS LLC.                 Tokyo                Japan
 42083  LiyingNetwork                  Tokyo                Japan
 42297  Netprotect                     Tokyo                Japan
 43063  k-kohei.jp                     Tokyo                Japan
 43744  SERVG.NET MG-Network           Tokyo                Japan
 45012  NEROCLOUD INC.                 Tokyo                Japan
 44988  Misaka Network, Inc.           Tokyo                Japan
I was also interested in non-local test server. This was trickier, but I found an Ookla XML feed that returns different lists based on your location. So I checked that while on a US VPN to get a second server ID.
With two IDs handy, I set up a cron job and that was it:
$ cat /etc/cron.d/speedtest
10 * * * * root (/usr/local/bin/speedtest -s 42297 -f json; /usr/local/bin/speedtest -s 10979 -f json) >> /var/log/speedtests
Setting up filebeat
The basic configuration if filebeat was simple. Just this:
$ cat /etc/filebeat/filebeat.yml
cloud.id: "(your deployment's cloud ID)"
cloud.auth: "(your cluster's user):(your cluster's password)"

filebeat.inputs:
  - type: log
    enabled: true
    paths:
      - /var/log/speedtests*
    scan_frequency: 1m
    json.keys_under_root: true
Getting filebeat set up on the Raspberry Pi was much more complicated. Elastic doesn’t have official binaries on the download page, so I ended up compiling from source. This required golang >= 1.16 which also isn’t available from Raspbian’s apt repositories. So I did this the old fashioned way.
First grab the armv6 version of golang, unpack that into $HOME.
Export the go path to where you extracted it and go binaries onto your shell path:
$ export GOPATH=$HOME/go
$ export PATH="$PATH:$HOME/go/bin"
Grab the beats source and get into the filebeat directory and run make:
$ git clone https://github.com/elastic/beats ${GOPATH}/src/github.com/elastic/beats
$ cd ${GOPATH}/src/github.com/elastic/beats/filebeat
$ make
Finally put the resulting binary into your path:
$ sudo mv filebeat /usr/local/bin/filebeat
If you ran into build trouble, feel free to post a note on the filebeat forum. You can even mention me, though I suspect other engineers will jump in before I even notice.
And finally I set up a systemd service to keep it running. I originally extracted this definition from the filebeat deb package and modified the executable path.
$ cat /etc/systemd/system/filebeat.service
[Unit]
Description=Filebeat sends log files to Logstash or directly to Elasticsearch.
Documentation=https://www.elastic.co/beats/filebeat
Wants=network-online.target
After=network-online.target

[Service]

Environment="GODEBUG='madvdontneed=1'"
Environment="BEAT_LOG_OPTS="
Environment="BEAT_CONFIG_OPTS=-c /etc/filebeat/filebeat.yml"
Environment="BEAT_PATH_OPTS=--path.home /usr/share/filebeat --path.config /etc/filebeat --path.data /var/lib/filebeat --path.logs /var/log/filebeat"
ExecStart=/usr/local/bin/filebeat --environment systemd $BEAT_LOG_OPTS $BEAT_CONFIG_OPTS $BEAT_PATH_OPTS
Restart=always

[Install]
WantedBy=multi-user.target
And enable the service.
$ sudo systemctl enable filebeat
Now if you have any tests in /var/log/speedtest, they should end up in filebeat-* in your Elasticsearch cluster.
A little more involved than docker compose up, for sure. But now we have a much more stable setup plus all the facilities of kibana at our disposal for analysis.
Graphing
There’s a bunch of data in the speedtest CLI JSON payload, but I was mainly interested in looking and downstream and upstream speeds over time.
The speeds recorded were a bit confusing at first. The main parts of the data look like this:
{
  "type": "result",
  "timestamp": "2021-10-12T05:10:16Z",
  "ping": { "jitter": 1.218, "latency": 8.1850000000000005 },
  "download": { "bandwidth": 3457698, "bytes": 15579024, "elapsed": 4404 },
  "upload": { "bandwidth": 5292178, "bytes": 23912512, "elapsed": 4502 },
  "isp": "ARTERIA Networks Corporation"
}
That download.bandwidth number is listed in bytes per second, but ISPs usually sell in megabits per second (Mbps). Thankfully Kibana lens now has formulas, so the conversion is easy. Just divide by 8, then 1000000. Or here I’ve used multiply to keep the formula short and simple.
multiply(median(download.bandwidth), 0.000008)
Same for downstream and we’re in business!
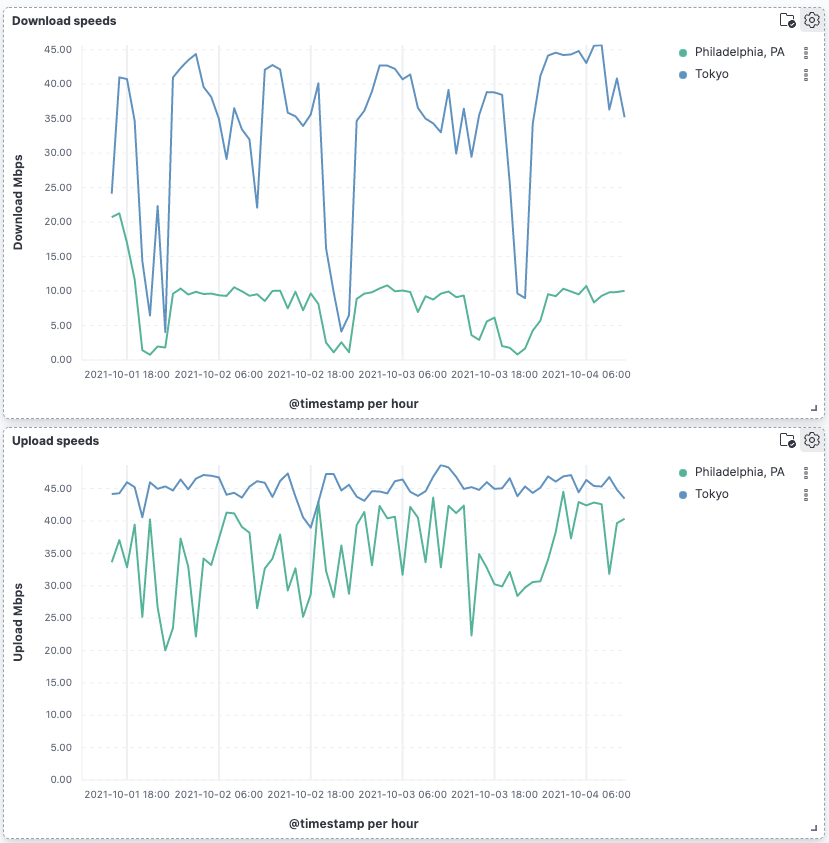
Results and Conclusion
With data in hand I can now see when my internet speeds get slow (mostly noon and 9p) and plan accordingly. Also interesting is that my upstream stays consistently high.
Once the covid situation calms down I may contact my ISP about other options, but I suspect issue extends beyond just my local ISP.
If you’d like to use the same dashboard, I’ve exported it here for import into your own kibana: internet-speeds-dashboard.ndjson